Ioana Jivet
What are our LDE CEL researchers currently working on? In this article Learning Analytics researcher Ioana Jivet gives a short introduction to her study on the Learning Tracker widget.
MOOC learners have multiple motivations for enrolling in a MOOC (e.g. general interest in the topic, job-relevance, career change, growth and enrichment) as well as multiple goals with regards to the MOOC (e.g. obtaining a certificate, acquiring new knowledge, developing specific know-how, completing assignments). At the same time, MOOC learners receive very little personalised support either from teaching staff or the platform itself to fulfil their goals.
In order to tackle this issue, we wish to support MOOC learners in achieving their respective goals by providing them with feedback on their learning behaviour through a learner dashboard. Dashboards are used as powerful metacognitive tools for learners to increase awareness, reflection and the ability to self-regulate. In this study, we investigate whether customising dashboards according to learners’ goals can increase their goal achievement. If learners had the choice to configure their own dashboard, what data would they choose to see? Is the choice of data influenced by the goals that they have for the MOOC or by their level of self-regulated learning and metacognitive skills?
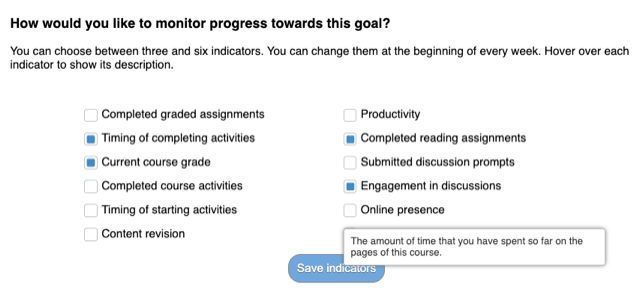
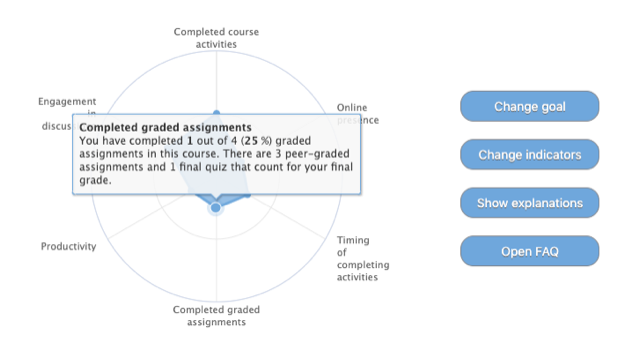
For this study, we are using a variation of the Learning Tracker, a visual feedback system that has been shown to increase MOOC completion rates[1]. The dashboard is currently implemented in two MOOC offered by Erasmus University Rotterdam on the Coursera platform. On the dashboard, learners can record their goal and select 3-6 feedback indicators to be displayed in a spider chart out of a list of twelve possible indicators. Learners have the chance to adjust both their goal and the selected indicators at the beginning of every week. The feedback displayed on the chart is calculated based on the data logs provided by Coursera and are updated daily. The dashboard is embedded in the course content, requiring no extra effort from the learners to access it.
[1] Davis, D., Jivet, I., Kizilcec, R. F., Chen, G., Hauff, C., & Houben, G. J. (2017, March). Follow the successful crowd: raising MOOC completion rates through social comparison at scale. In Proceedings of the seventh international learning analytics & knowledge conference (pp. 454-463).