Learning analytics dashboards are single displays that combine different indicators about learners, the learning process and/or the learning context into one or multiple visualisations. In the early days of learning analytics, they showed great promise in supporting learners to learn more effectively and improve their learning performance. But so far, this promise hasn’t been fulfilled and learners rarely adopt and use learning dashboards consistently.
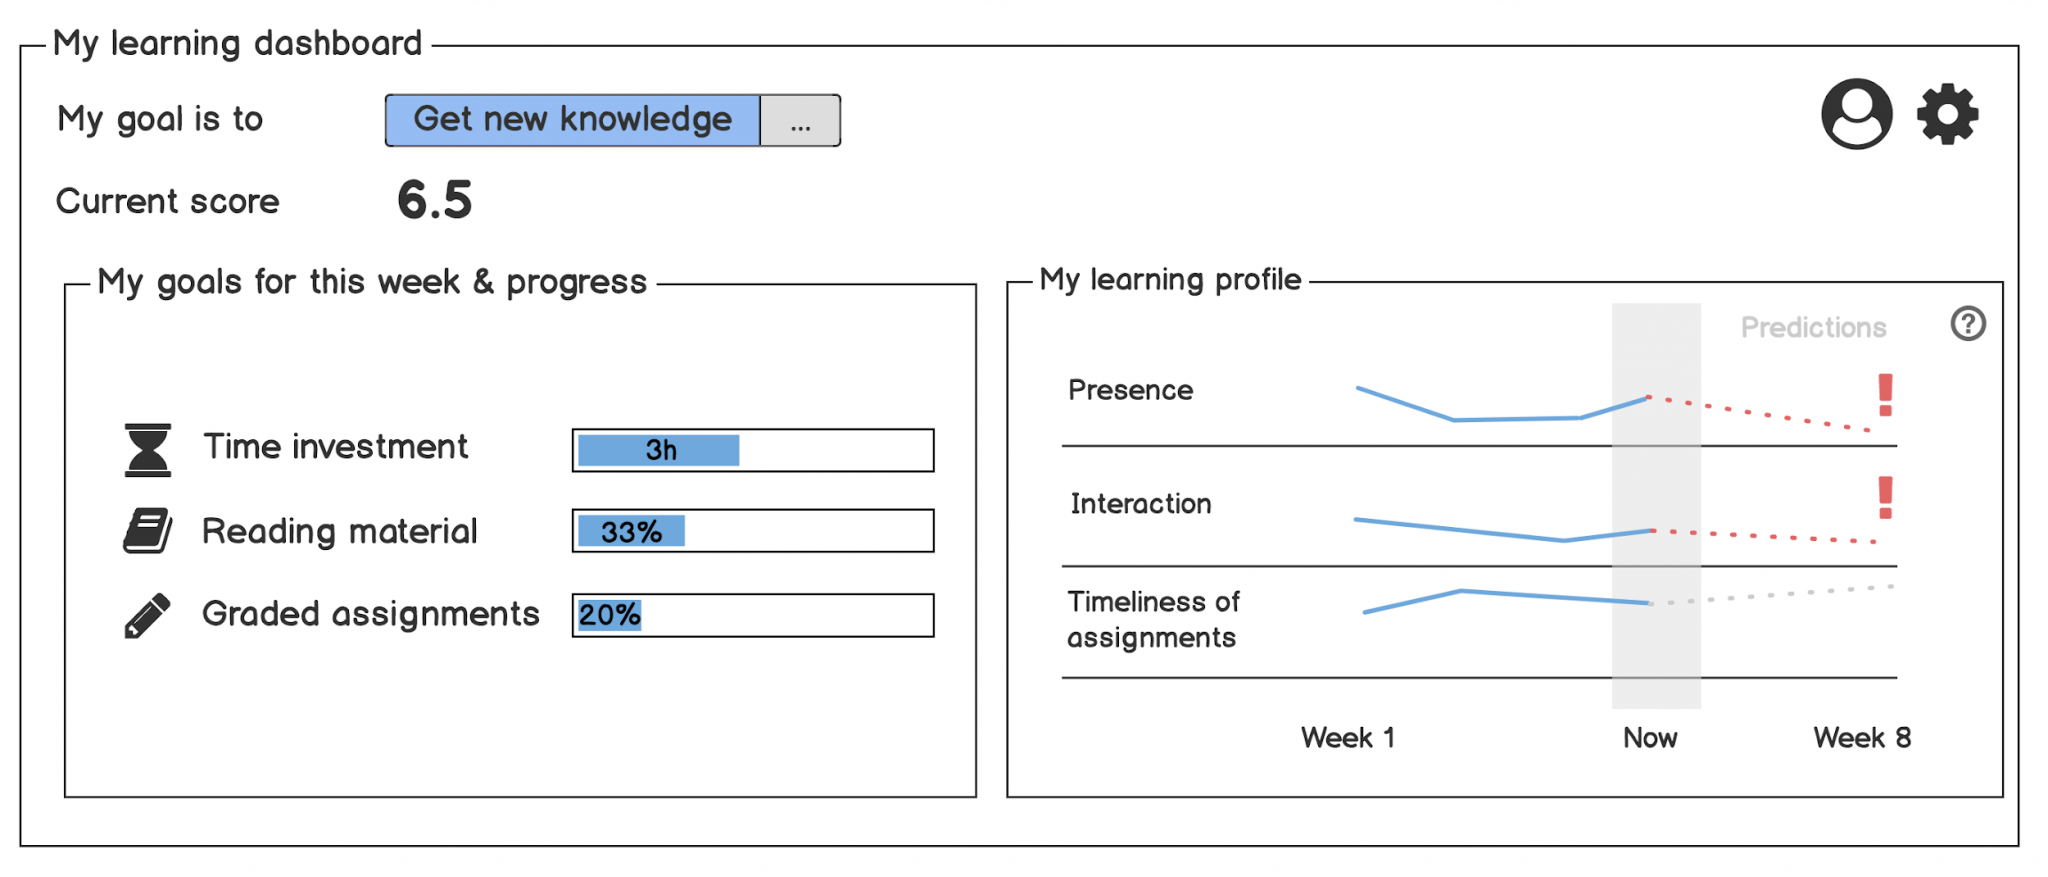
We set out to investigate why that is. We asked 247 First- and second-year students from Zuyd Hogeschool, a Dutch university of applied sciences, what dashboard features they find relevant and helpful when interpreting the information displayed on a mock-up dashboard (see figure). Two themes emerged from the answers we received.
Students want dashboard designs to be transparent
This means that students highly value explanations on how different dashboard elements relate to each other, how indicators are calculated, why the shown information is relevant for learning and for goal achievement, and what the scales are on which the indicators are displayed.
Students need support for action
Students need features that support them to make decisions about their learning. Such features encourage and help students to follow-up on the feedback they received through the dashboard and take concrete actions: recommendation on what course topics to tackle next, receiving additional information on topic difficulty and the estimated time of completion, as well as recommendations on how to change their behaviour.
Understanding how learners make sense of the information and graphs shown on dashboards and whether all learners interpret dashboards similarly is a first step towards building dashboards that target the needs of the learners, the intended end-users, increasing the chances of adoption.
No creative work is unbiased, but by engaging learners to think along when we are designing tools for them we can set the focus on their needs, preferences and skill level. With such information available, designers and researchers can build more inclusive and flexible designs that also cater to the needs of less-skilled learners.
The full scientific article reporting on this study is available and can be found in the attachment below.
Read more
Jivet, I., Scheffel, M., Schmitz, M., Robbers, S., Specht, M., & Drachsler, H. (2020). From students with love: An empirical study on learner goals, self-regulated learning and sense-making of learning analytics in higher education. The Internet and Higher Education, 100758.